


Jim Simons, the legendary founder of the Renaissance Technologies hedge fund, passed away on May 10th. He was a true character — a chain-smoking, plain-spoken, and sardonic leader of a group of eccentric quants living on Long Island. From 1988 through 2021, the Medallion Fund generated an astonishing average annual return of 62% over the years. You can read more about his story here:
The Man Who Solved The Markets
But you’re probably wondering why the title of this article is not Simons’s Demon. That’s because he reminded me of my favorite investment book of all time, which is Fortune’s Formula by William Poundstone. People love to give away copies of their favorite book, so I’ve had to repurchase this book many times.
First, Fortune’s Formula is not just a book about making a fortune. The origin stories are fascinating. For example, did you know that Sir Isaac Newton lost most of his fortune in the South Sea Trading Company? Said Newton:
I can calculate the motions of heavenly bodies, but not the madness of people.
So, who is Shannon and what is the Demon? Well, Claude Elwood Shannon is best known as the father of information theory, establishing the foundation for artificial intelligence and machine learning. He had diverse interests such as juggling, chess, and unicycle riding.
But Claude and his wife Betty were also known as superb investors. So, of all his talks at MIT, the most popular one was a way “for making money off the fluctuations in stocks”, derived from the thought experiment, Maxwell’s demon. Today, the technique is known as volatility harvesting. Let’s demonstrate the technique from the example in the book.
Shannon proposed a stock demon that works as follows:
Start with a portfolio that is balanced 50/50 between stock and cash.
The stock either halves or doubles every time step.
After each time step, rebalance the portfolio so that the proportions of stock and cash are maintained 50/50.
Suppose we start with a portfolio of $10,000 and the stock price is $10, so we start with a cash position of $5,000 and a stock position of 500 shares (500 x 10). Suppose the stock then doubles to $20. Our stock position is now worth $10,000. Since the total portfolio value is now $15,000, we would sell 125 shares ($2,500) to rebalance, with $7,500 in cash and stock apiece (500 - 125 = 375 shares).
Now, the stock drops 50% from $20 to $10. The total portfolio is now worth $7,500 plus $3,750 (375 x 10) equals $11,250. If we just bought and held the stock, we’d be back to our original $10,000. But with rebalancing, we preserved $1,250 of gains despite the stock drop.
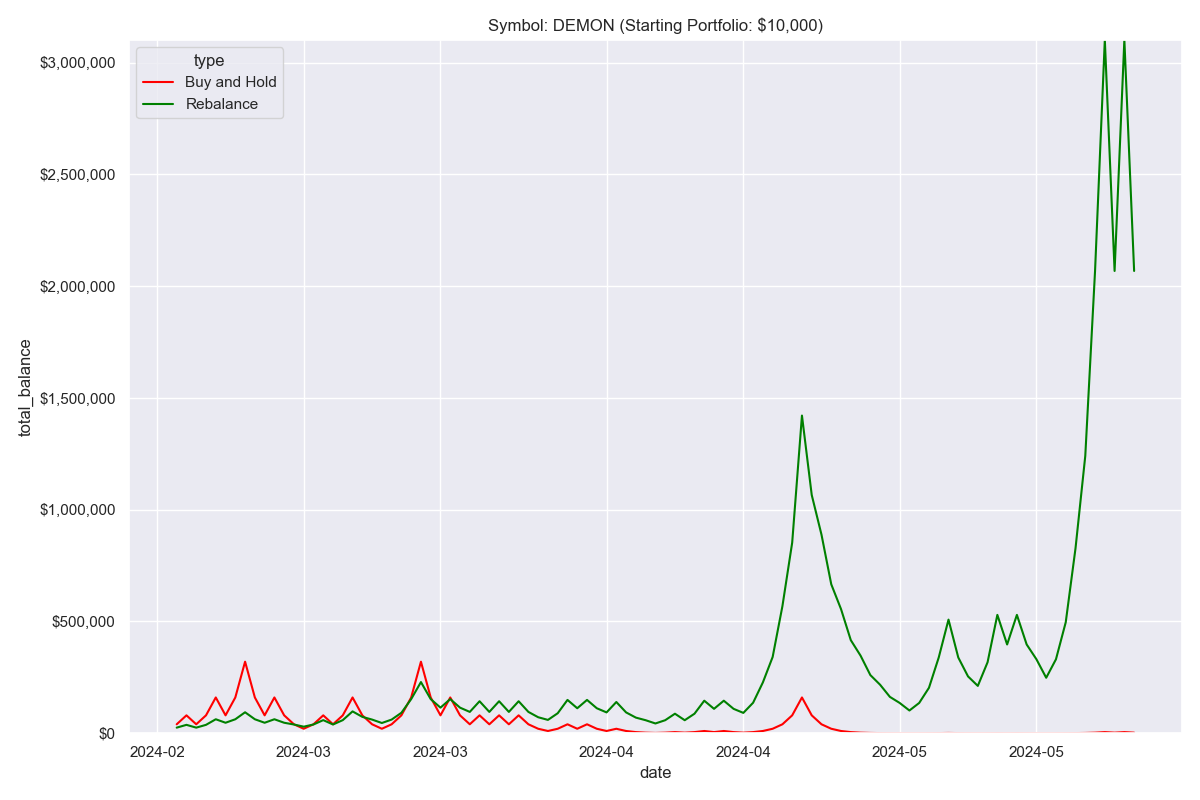
The simulation below is just an example of the snowball effect for our theoretical stock, where the rebalanced portfolio grows from $10,000 to as high as $3 million in 100 days, while the buy-and-hold portfolio goes nowhere. Of course, you’ll never find a stock that behaves like this in the real world, but the exercise is instructive.
How does Shannon’s Demon work in the real world, and is there ever a scenario where rebalancing is useful? Let’s take a look at a few stocks and apply the same thresholds for rebalancing, knowing that reaching these thresholds will be relatively rare.
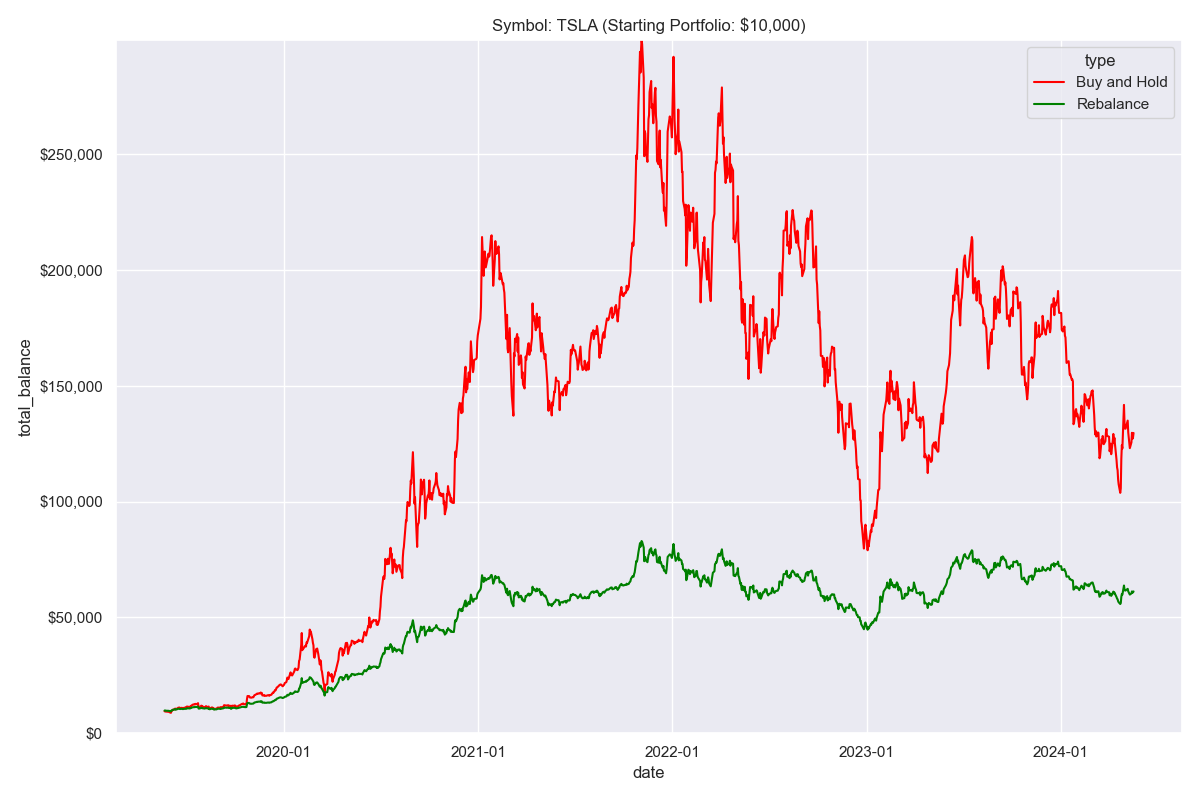
You can see the downside to rebalancing for Tesla ($TSLA). Clearly, a rebalancing strategy of harvesting gains means not participating in the full upside. Despite the 70% drawdown in 2022, the buy-and-hold portfolio is still worth double that of the rebalancing strategy. If anything, the rebalancing strategy is a way to dampen volatility of a portfolio.
Still, over the 5-year study period, there were 8 rebalancing points where either the stock had doubled or halved.
Date: 2019-12-23 High Target Hit: 27.38
Date: 2019-12-23 New Low Target: 13.97, New High Target: 55.90

Date: 2020-02-04 High Target Hit: 55.90
Date: 2020-02-04 New Low Target: 29.57, New High Target: 118.27

Date: 2020-03-17 Low Target Hit : 29.57
Date: 2020-03-17 New Low Target: 14.34, New High Target; 57.36

Date: 2020-06-01 High Target Hit: 57.36
Date: 2020-06-01 New Low Target: 29.94, New High Target: 119.75

Date: 2020-08-17 High Target Hit: 119.75
Date: 2020-08-17 New Low Target: 61.19, New High Target: 244.75

Date: 2021-01-05 High Target Hit: 244.75
Date: 2021-01-05 New Low Target: 122.52, New High Target: 490.07

Date: 2022-12-27 Low Target Hit : 122.52
Date: 2022-12-27 New Low Target: 54.55, New High Target; 218.20

Date: 2023-06-06 High Target Hit: 218.20
Date: 2023-06-06 New Low Target: 110.65, New High Target: 442.62

Final Portfolio Value: 61167.52
Let’s take a look at crypto, specifically Ripple ($XRP-USD):
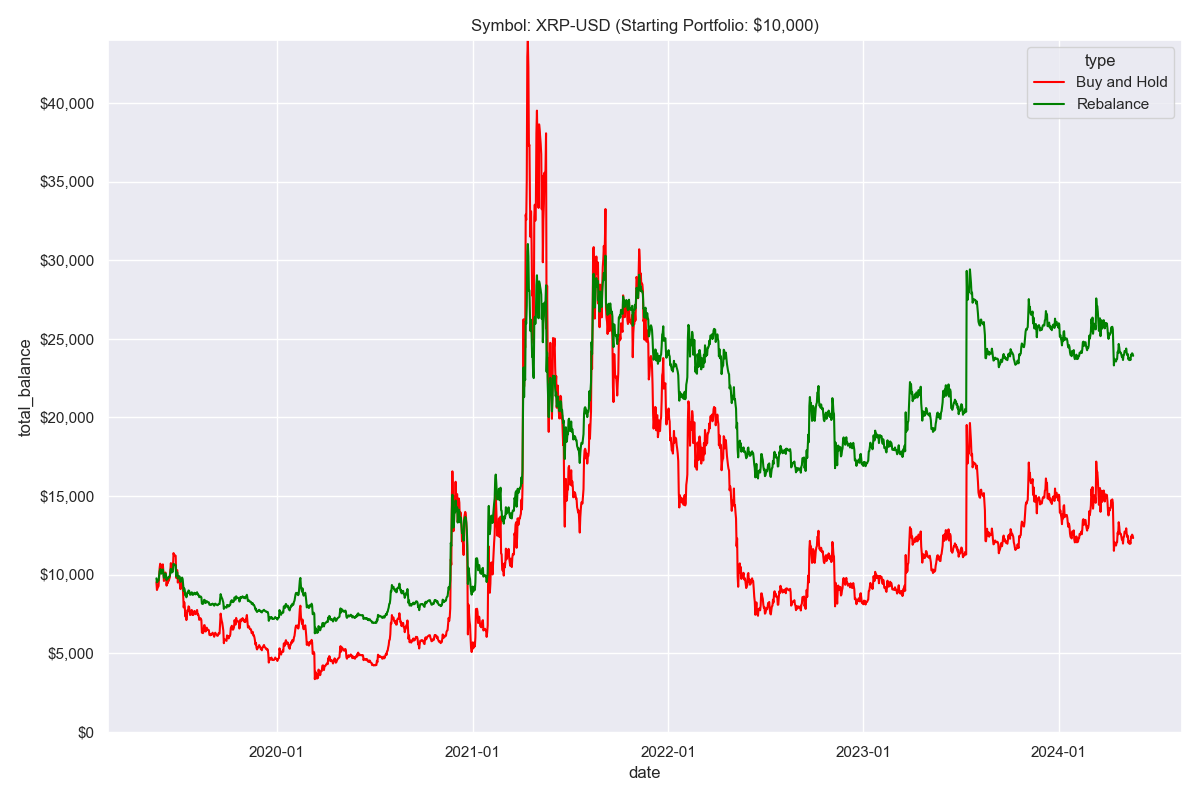
In this case, the rebalanced position is worth double the buy-and-hold position. The difference is that during this period, Ripple has essentially gone nowhere, yet still had 10 rebalancing points to successfully harvest volatility.

Bitcoin:
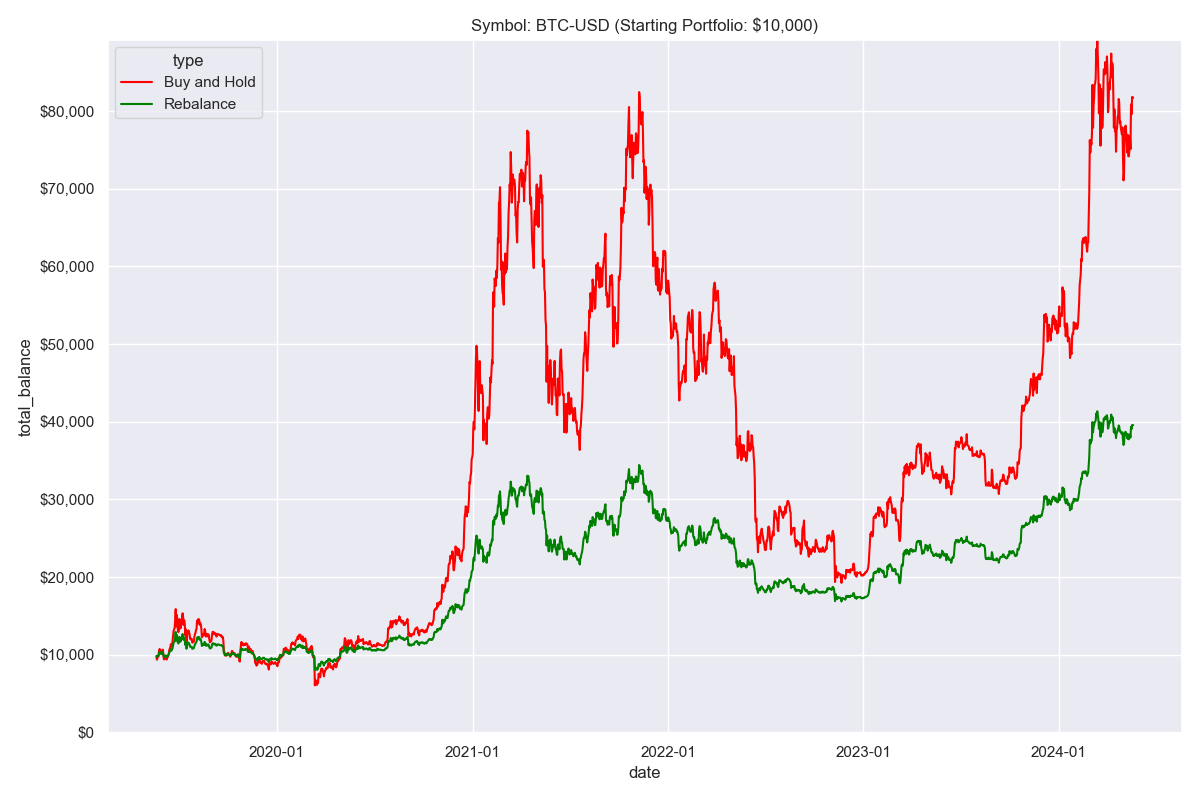
Again, here is a case where buy-and-hold has doubled rebalancing (5 rebalance points), but consider that:
Since the pandemic began in March 2020, we’ve been in a secular bull market for all assets for the past 4 years.
Rebalancing dampens the volatility of any asset, but does not eliminate the risk of an asset going to zero.
Rebalancing is an effective tool for periods of low expectations.
If you’d like to experiment with the code and data, you can find the GitHub repository here: